
Analyze and Forecast
time series
.Hourly
.Daily
.Weekly
.Monthly
.Bi-Monthly
.Quarterly
.Bi-Annually
.Yearly
(DIAL/DATA computrac ascii compatible)
FOURCAST will analyze either univariate or multivariate time series. (A collection of observations made sequentially in time)
Designed to address a broad spectrum of users in science (physics, chemistry, meteorology, environment, etc), business (marketing, accounting, finance, economics, etc) and industry.
Popular applications include index values, price, income, power system loading, sales, gross national product, population, temperature and rainfall. FOURCAST will also process data for multivariate analysis, using several time series, regarding them as auto correlated (the association of each variable with itself over time) and cross correlated (the association between different variables).
Simple to use and flexible


.Pop-up main and sub menus
.Keyboard macro automation
.Telecommunications
.Easy updating
.Prompt instructed interactive input
.A user oriented editor
.Data transformation function
.Selective printing and plotting


Optional report types


.Color graphics history & forecast
.Tabular history & forecast
.User/Event adjusted forecast
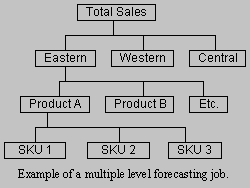
.Multiple level forecasting & aggregation
.Sales, Revenue, Profit, Production & Budget reports
.Batch forecasts of unlimited numbers of files
.Analysis of variance
.Parameter estimates
.Inferential statistics
.Analysis of residuals
.Plot of Historical data + 1,2,3.. sigma upper & lower limits
.Plot of Residuals + 1,2,3.. sigma upper & lower control limits
.Plot of Fitted values + 1,2,3.. sigma upper & lower limits
.Histogram of Historical data
.Histogram of Residuals
.Histogram of Fitted values
.Comparison of actual and forecast
.Frequency and Impulse response plots

FOURCAST employs a technique known as the Moving Window Spectral Antithetic (MWSA) time series
method. This method is particulary effective when the time series
contains cyclical components. Spectral analysis is used to perform an
in depth analysis of the trend and cyclical components. A moving time domain window is used to determine how each cyclical component is changing over time.
One component may be growing while another component may be shrinking (no other method can do this).
The cycles are forecast individually, then recombined. The forecast is dynamic.
When the forecast cycles are in alignment, turning points and changes
in trend will occur. Also, antithetic forecasting (combines 2 forecasts
with negatively correlated errors) is used to reduce bias and minimize
forecasting error.
Then, expand your ideas: utilize more data, electronic stock market,
commodity, options, economic and other financial data bases, statistical process control (spc),
biomedical process control, financial auditing, multi-level forecasting/supply chain management, logistics,
a user's monograph + educational magazine article, case based & research
journal references, and much much more!
Technical and Scientific Literature
FOURCAST Home Page
http://www.fourcast.net
 .Pop-up main and sub menus
.Keyboard macro automation
.Telecommunications
.Easy updating
.Prompt instructed interactive input
.A user oriented editor
.Data transformation function
.Selective printing and plotting
 .Color graphics history & forecast
.Tabular history & forecast
.User/Event adjusted forecast
.Multiple level forecasting & aggregation
.Sales, Revenue, Profit, Production & Budget reports
.Batch forecasts of unlimited numbers of files
.Analysis of variance
.Parameter estimates
.Inferential statistics
.Analysis of residuals
.Plot of Historical data + 1,2,3.. sigma upper & lower limits
.Plot of Residuals + 1,2,3.. sigma upper & lower control limits
.Plot of Fitted values + 1,2,3.. sigma upper & lower limits
.Histogram of Historical data
.Histogram of Residuals
.Histogram of Fitted values
.Comparison of actual and forecast
.Frequency and Impulse response plots


