

FOURCAST is the engine for performing all calculations for FOURCAST SPControl.
For clear SPC problem identification and reliable decision making,
you can create:
Progressive alarm system (see sample screens below):
One breach of any chart: BLUE SCREEN.
Two consecutive breaches of any chart: YELLOW SCREEN.
Three consecutive breaches of any chart: RED SCREEN +
Examples of clearly labelled and easy to read FOURCAST SPControl charts are temperature and pressure charts, etc. Multiple variables are analyzed for auto and cross correlations. If unacceptable values occur on any of the charts, or if the monitor is disconnected, it will automatically create sound and color alarms that are audible, and visible from a distance. In a noisy industrial environment, the full screen progressive blue-yellow-red color alarms are easy to recognize. Pager/beeper or phone notification also occurs automatically. Up to date charts may also be emailed and/or faxed to a quality control professional anywhere in an industrial plant or anywhere in the word. A hard wire or wireless link between the data collecting sensor and the computer will permit the computer to be placed in a protected environment, remote from the industrial operation being monitored. It is easy to use and ideal for industrial applications or computer room temperature monitoring, etc.
Click on the reference below to read a related article.
Single versus Dual process control charts
Click on the reference below to select the teaching case and/or data set that you wish to download. They are designed to work with all versions of the computer software FOURCAST SPControl, including the educational version <(click here to download FOURCAST SPControl then install it). FOURCAST is the engine for performing all calculations for FOURCAST SPControl.
CASE: Common cause Special cause Statistical Process Control
CASE: Pro-active Statistical Process Control
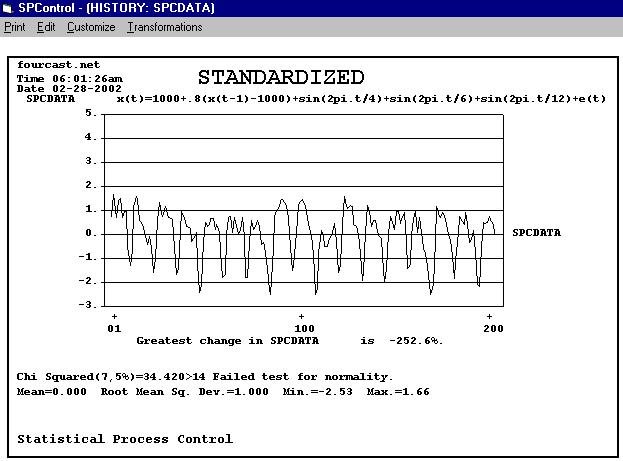
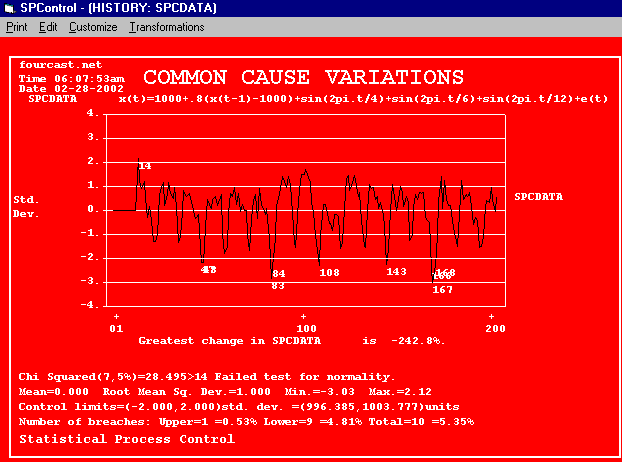
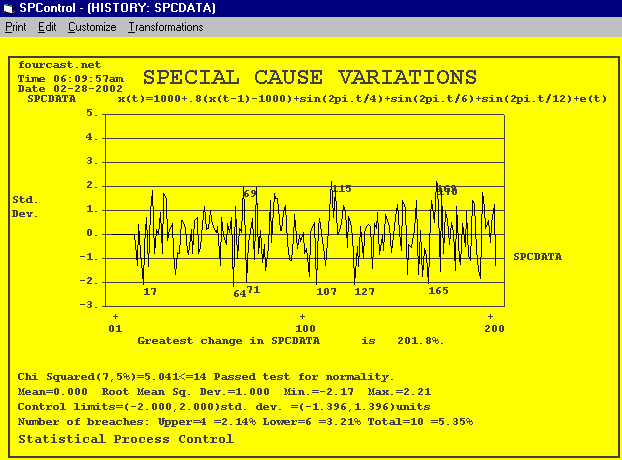
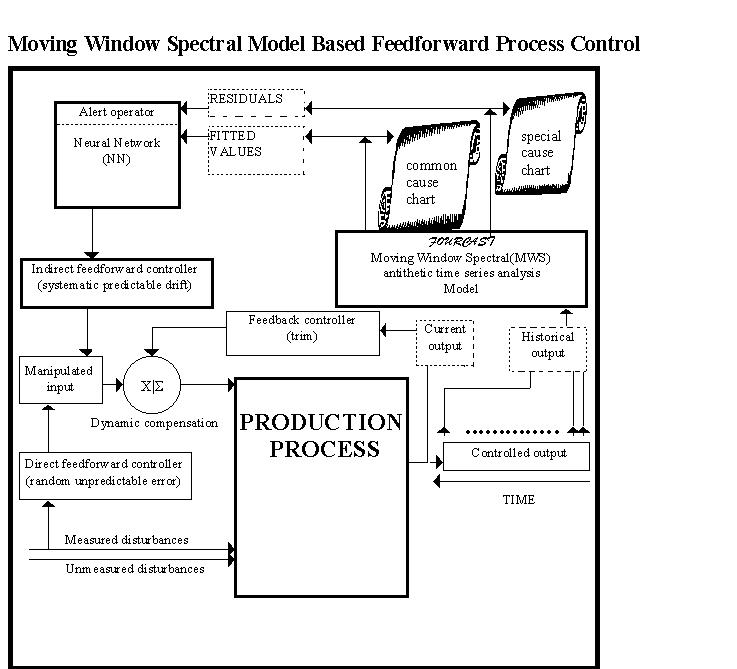
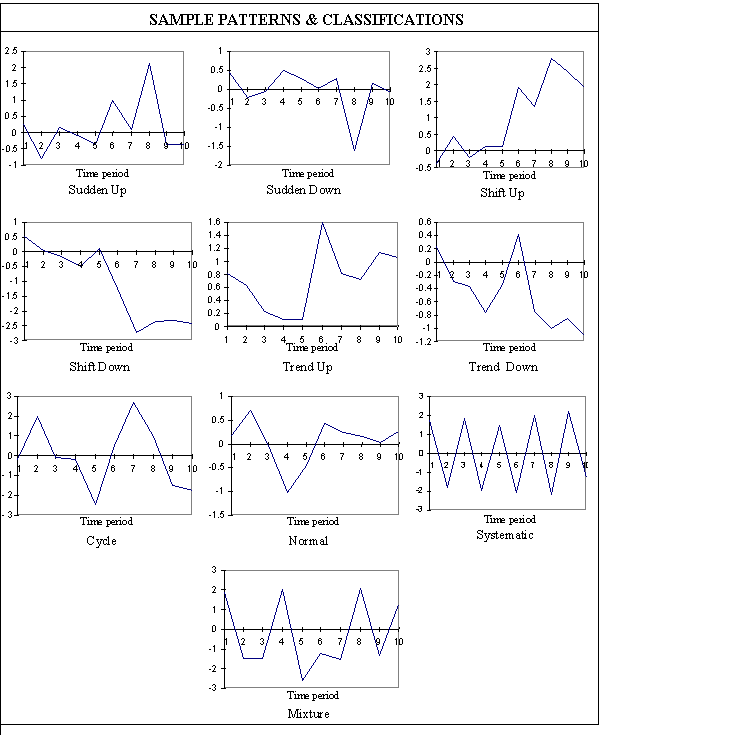
Time series analysis has many applications. How it is applied, depends very much on the particular application. The following information is intended as a guide to statistical process control applications. Statistical process control by a simple control chart of a process variable, is based on the assumption that the process variable is an independent identically distributed random variable. That is, measurements taken on the process result in a sequence of numbers that are unrelated to each other. It is now well known that this is not a valid assumption. In practice the process variable typically contains significant correlations due to persistent common cause effects. These common cause effects become confounded with random one of kind special cause effects. The objective of time series model based statistical process control is to separate the process variable into two components namely the systematic variation due to common cause (contained in the fitted values) and the purely random variation (contained in the residuals). The process can then be controlled by 1) identifying and removing the source of common cause effects and 2) correcting the cause of special effects observed as outliers on a control chart of the residuals. Time domain time series models are limited in their ability to represent cycles in the data. The moving window spectral antithetic (MWSA) time series model is a frequency domain approach. It is an extension of the time series concept, to a generalized automatic system which further decomposes the process variable into trend, periodic components and residuals. However, the main objective of this information, and the test that follows is a critical examination of the the way in which we view this application, and in general, the role of time series analysis special cause charts and common cause charts.

ASSUMPTION: SPC data are made up of trend, cyclical, and random components. The random component is plotted on a special cause chart, marked with 3 sigma upper and lower control limits. The systematic trend and cyclical components are plotted on a common cause chart, marked with 3 sigma upper and lower control limits. These charts are continuously updated and made available to process control personnel, who:
1. Examine the special cause chart.
If any plotted data point falls outside the control limits,
stop the process and investigate the cause. Since the data on this chart
are independent, look for special one of a kind causes, such as a bad batch
of raw materials. Something that will not necessarily happen again, or happen
in the same way. For example, if a bad batch of raw materials is found,
the supplier should be contacted, and notified of the consequences.
2. Examine the common cause chart.
If there is a recognizable pattern, attempt to associate
the pattern with its probable cause, likely to continue occuring. For example
a cyclical pattern may be due to a worn bearing. If this can be established,
then the bearing could be changed during the next scheduled plant maintenance
shut down. Otherwise the bearing wear may reduce product quality.
It will eventually fail, forcing an unscheduled shut down, a new bearing
anyway, and all the attendant costs of a forced shut down. All parts must wear,
and must wear out eventually. The time to change the worn bearing, prior
to complete failure is an economic decision. One way to use the common chart
3 sigma limits is as follows. If there is a breach of the common chart
3 sigma limits, assume that bearing failure is imminent and replace it as
soon as practicable.
FOURCAST is the engine for performing all calculations for FOURCAST SPControl.

Questions
Answer each of the following multiple choice review questions by
selecting the response which is most immediately appropriate.
FOURCAST is the engine for performing all calculations for FOURCAST SPControl.
You can create Special cause SPC charts of residuals, Common cause SPC charts of fitted values
for clear problem identification and reliable decision making.
If your web browser does not support forms, then scroll past the following form for insrtuctions on how to order FOURCAST SPControl.
If unable to use order form, send check or money order to:
Engineering Management Consultants, Inc., P.O.Box 12518, Centerville Road, Tallahassee, FL 32317-2518.
Or call in your visa or master card number to Engineering Management Consultants, Inc. at Tel (850)668-0635 Fax (850)668-5937.
Or send your address, phone#, visa or master card number and expiration date to email:fourcast@fourcast.net
Remember to specify which FOURCAST SPControl system you are ordering.
Thank you and have a nice day.