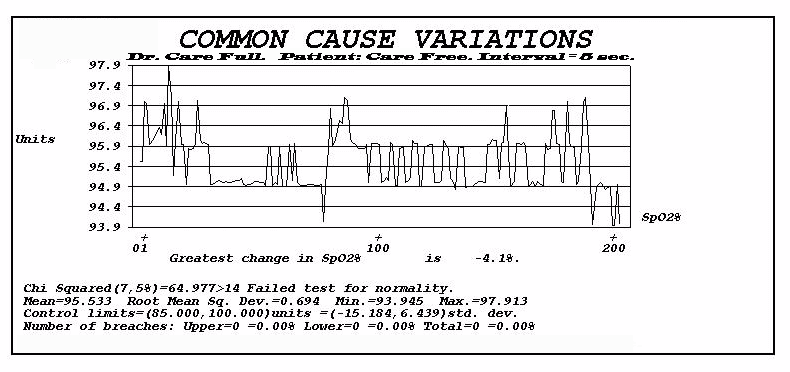
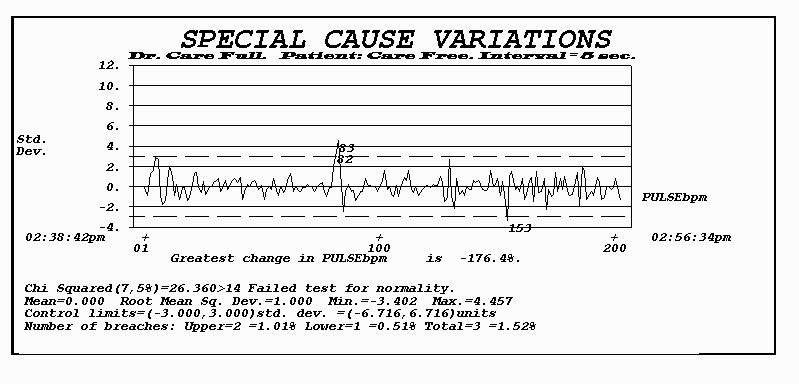
Time series analysis may be applied to biomedical data.
The data in the charts below are two examples, obtained in real time from a pulse oximeter.
The information provided below, including the charts, a training test, case study,
and computer software are intended for educational use.
Scroll down to: Test your Biomedical data analysis IQ. >>>>
CASE STUDY: Common cause Special cause Biomedical Charts
Download and install Educational Software.
After installing the software click on the program's main menu CUSTOMIZE and make the appropriate selections, then click on COMMUNICATIONS/Monitor.


Time series analysis has many applications. How it is applied,
depends very much on the particular application. The following information
is intended as a guide to biomedical process control applications.
Process control by a simple control chart of a process variable, is based on the assumption
that process measurements result in a sequence of numbers that are unrelated to each other.
Biomedical vital signs data are not unrelated. They are correlated (systematic).
Also, the correlation may be varying due to the effect of healing or due to failing
health. These systematic effects are called
common cause internal biological effects. In addition to these systematic effects,
the data will contain unsystematic random one of a kind special effects. These may be
due to irregular heart beat, a loud sound, a bright light, temporary mental or physical exertion, etc.
These are called special cause external environmental effects. The common cause effects
are normally confounded with the special cause effects. This makes it difficult to analyze
internal biological vital signs. The result is unnecessary medical intervention
(false positives), misdirection and possible harmful over medication in some cases,
and real problems being overlooked in other cases (false negatives).

The objective of time series model based biomedical process control is to separate
the data into two components namely the common cause internal biological effects
and the special cause external environmental effects. These two components are plotted
on separate charts. This makes it possible to better understand the health data.
Time domain time series models are limited in their ability to represent periodic (cyclical)
components in the data. The moving window spectral antithetic time series model is a frequency
domain approach. It is an extension of the time series concept, to a generalized automatic system
which further decomposes the process variable into trend, periodic components and residuals.
However, the main objective of this information, and the test that follows is a
critical examination of the way in which we view this application,
and in general, the role of time series analysis common cause charts
and special cause charts.

Summary of suggested rules for implementing a biomedical charting plan
ASSUMPTION: Biomedical data are made up of a common cause internal biological component
and a special cause external environmental component. Each component is plotted on its own
chart. The charts are marked with upper and lower medical standard values, depending on
age and sex, for a normal healthy person. Since standard upper and lower limits assume
that one size fits all persons within an age and sex classification, a second
set of charts are plotted in terms of standard deviations. These are marked with upper
and lower 3(for example) standard deviation control limits. Once the common cause component
is separated from the special cause component, the standard deviation for the special cause
chart is reduced, the width of the 3 standard deviation limits narrows, and the chart becomes
more discriminating. The common cause and special cause charts are continuously updated and made
available to medical personnel, who:
1. Examine the special cause charts.
If any plotted data point falls outside the control limits, investigate the cause.
Since the data on this chart are independent, consider special one of a kind causes,
such as temporary mental or physical exertion, or known medical intervention.
Something that will not necessarily happen again, or happen
in the same way.
2. Examine the common cause charts.
If any plotted data point falls outside the control limits, investigate the cause.
If there is a recognizable pattern, attempt to associate the pattern with its probable cause.
Scroll down to: Test your Biomedical data analysis IQ. >>>>

Instructions
This review is designed to determine how well you understand the application of time series
analysis to biomedical data. When you are satisfied that you have answered the questions
correctly, you are ready to use the computer software program.
Please feel free to use this self-evaluation test as often as you like.
In order to receive anonymous feedback, click on the score button at the end
of the test.
Questions
Answer each of the following multiple choice review questions by
selecting the response which is most immediately appropriate.


 software
Adjustable chest strap heart rate sensor/transmitter communicates wirelessly with your computer.
Light weight. Comfortable. Water proof. Safe. Ultra intelligent. 2500 hours.
Alarm: Progressive sound, color, print/fax/email and caller ID phone alert.
Automatically calibrates to child, adult, male & female norms.
Automatically adjusts to individual personal characteristics.
Computer will make phone calls.
No batteries to change.
Patent number 6897773


